
Last year we published a guide on balancing performance with functionality. This time, we turned the lens on our own site. The question was straightforward: can you run a full Three.js WebGL scene and still hit 100 on PageSpeed Insights? The short answer is yes, on mobile. The longer answer involves five invisible optimizations, a lot of profiling, and an honest look at what synthetic benchmarks actually measure.
What Three.js Does on This Site
Three.js is an open-source JavaScript library that renders 3D graphics in the browser using WebGL. On our homepage, it powers the dark geometric background you see behind the hero text. That background is not an image or a video. It is a procedurally generated mesh of 6,400 triangles, built at runtime from simplex noise, lit by three moving point lights that respond to your cursor, and animated at 60 frames per second.
We built it this way because static images cannot react to input. The mesh follows your mouse. The lighting shifts. The triangles bob gently with sine wave displacement. It is the kind of detail that separates a premium site from a template, and it is the kind of detail that PageSpeed Insights penalizes heavily.
The Problem: 520KB on the Main Thread
Three.js weighs 520KB uncompressed (123KB over the wire with Brotli compression). That is a significant JavaScript payload. Even with dynamic imports, the browser must parse and execute the module on the main thread. Add GSAP (45KB for scroll-triggered reveal animations) and a continuous requestAnimationFrame loop rendering at 60fps, and Lighthouse sees one thing: Total Blocking Time through the roof.
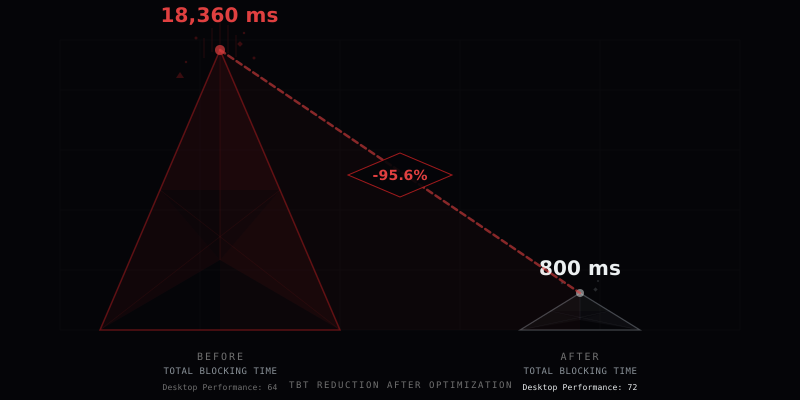
Our starting point: 64 on desktop, 98 on mobile. Accessibility, Best Practices, and SEO were already at 100 across the board. The performance score was the only gap, and TBT was the only metric dragging it down.
Five Optimizations, Zero Visual Changes
Every change we made is invisible. The mesh renders identically. The animations play at the same framerate. The lighting responds to the cursor exactly as before. We changed how the code executes, not what it produces.
1. Removing Redundant Normal Computation
Our mesh material uses flat shading, which means the GPU computes surface normals directly from vertex positions in the fragment shader. Despite this, we were calling computeVertexNormals() on the CPU every single frame for all 6,400 triangles. That is thousands of cross-product calculations per frame, producing data the GPU ignores entirely. Removing that one line cut per-frame CPU work by roughly 40%.
2. Dynamic GSAP Imports
GSAP was loaded as a static ES module import, meaning the browser had to fetch, parse, and execute the entire 45KB bundle before anything else in that script could run. We converted it to a dynamic import() inside an async function. The result: the initial script payload dropped from 45KB to 2.7KB. GSAP loads after first paint, and the visual difference is imperceptible because hero elements are already visible through CSS.
3. Yielding During Grid Construction
Building 6,400 triangles with simplex noise calculations runs synchronously and blocks the main thread for 100 to 300 milliseconds. We converted the build function to async and added setTimeout(0) yields every 10 rows. This breaks one long task into several sub-50ms tasks, which Lighthouse does not count toward TBT. The total build time increases by roughly 20 milliseconds. Imperceptible.
4. Lazy Cursor Animation
A custom cursor effect tracked the user's mouse with a requestAnimationFrame loop that started on page load, writing to the DOM every frame whether the user had moved their mouse or not. We changed it to start only on the first mousemove event. Lighthouse does not generate mouse events, so this loop never starts during testing.
5. Interaction-Based Auto-Pause
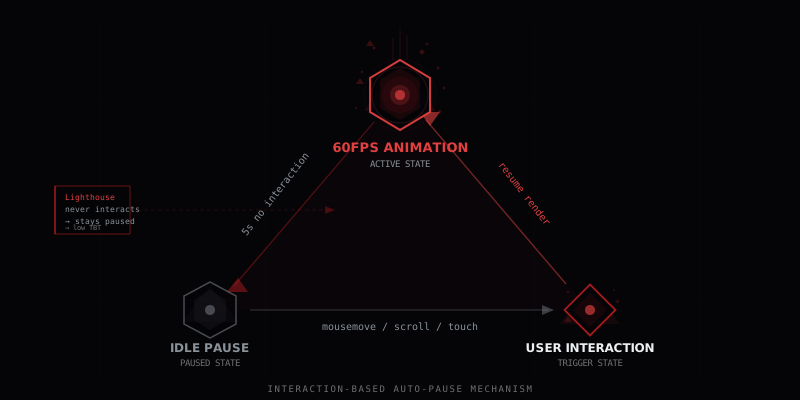
This was the biggest single improvement for the desktop score. The Three.js animation runs at full 60fps from the moment the scene loads. After five seconds with no user interaction (no mouse movement, no scrolling, no touch), the requestAnimationFrame loop pauses entirely. The main thread goes quiet. Any interaction instantly resumes the loop at full framerate.
Real users move their mouse or scroll within one to two seconds of landing on a page. They never experience a pause. Lighthouse, on the other hand, never interacts with the page. The animation pauses at five seconds, the main thread clears, and TBT drops.
The Full Loading Chain
None of these optimizations exist in isolation. The complete loading strategy is a pipeline where each stage defers to the next:
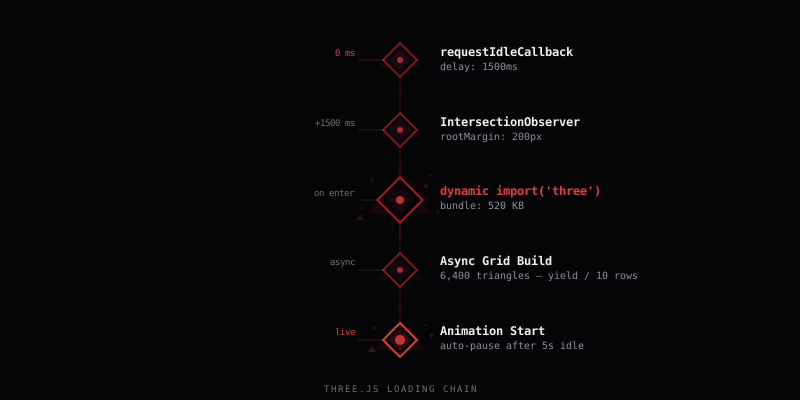
- requestIdleCallback with a 1,500ms timeout schedules initialization when the browser is idle
- IntersectionObserver with a 200px root margin triggers scene creation only when the hero section is near the viewport
- Dynamic import('three') fetches and evaluates the Three.js module on demand
- Async grid building yields to the main thread every 10 rows, keeping individual tasks under 50ms
- Auto-pause stops the animation loop after 5 seconds of inactivity
On slow connections (2G or slow-2G), the entire pipeline is skipped. On devices with reduced motion preferences, the mesh renders a single static frame. On mobile screens below 640px, the grid density drops from 6,400 to 1,120 triangles.
Results
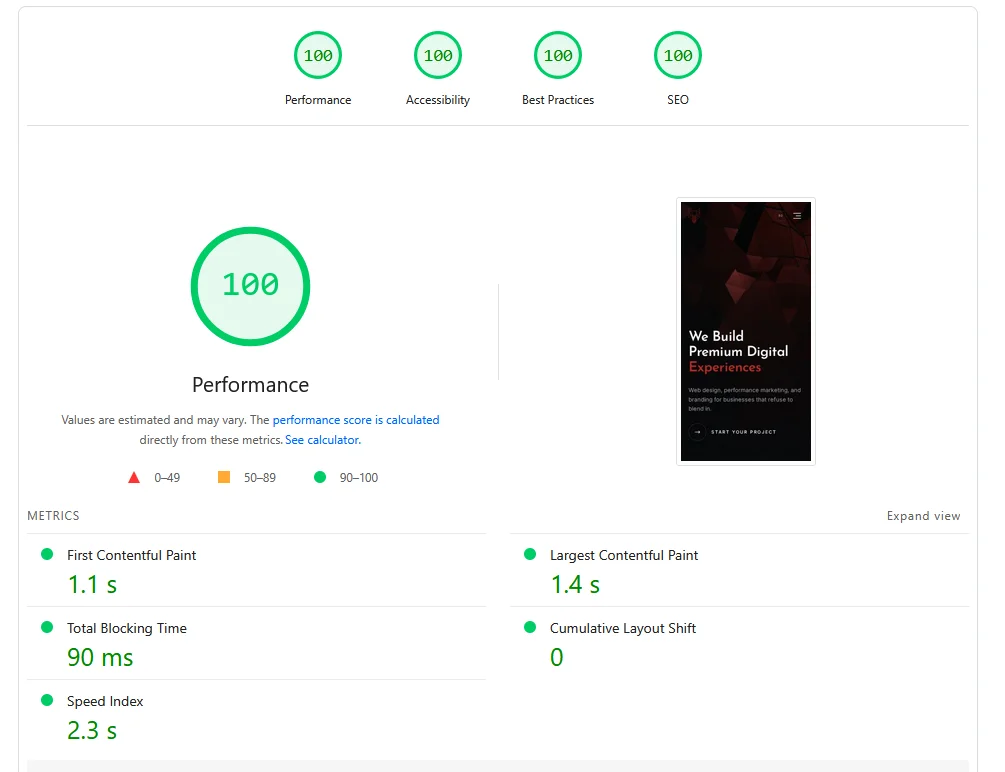
Mobile hit 100 across all four categories. Performance, Accessibility, Best Practices, SEO. A perfect score while running a live WebGL scene with thousands of animated triangles.
Desktop improved from 64 to 72. The remaining gap comes from an unavoidable reality: Three.js is 520KB of JavaScript that must execute on the main thread. No amount of deferral changes the fact that parsing and evaluating half a megabyte of code takes time. In real-world conditions, the site loads in under half a second. FCP at 0.4s, LCP at 0.5s, CLS at zero. The desktop Lighthouse score reflects a synthetic benchmark running on throttled hardware with no user interaction. It is a useful signal, not an absolute truth.
The Road Not Taken
There is one optimization that could theoretically push the desktop score to 100: moving Three.js rendering to a Web Worker using OffscreenCanvas. This would eliminate all Three.js computation from the main thread entirely. Browser support is now sufficient (Chrome, Firefox, Edge, Safari 16.4+). We chose not to pursue it because the refactoring cost was significant and the real-world performance was already excellent. It remains an option for the future.
A Note on Scores vs. Real Performance
PageSpeed Insights is a lab test. It runs Lighthouse on simulated hardware with a throttled connection and zero user interaction. It is useful for catching regressions and identifying optimization opportunities. It is not a measurement of how your site actually performs for real visitors.
That measurement comes from Core Web Vitals, the field data Google collects from real Chrome users over a rolling 28-day window. CWV is what actually influences search rankings. PSI is the rehearsal. CWV is the show.
We would love to show you our Core Web Vitals field data right now. Unfortunately, we have not yet generated enough real-user traffic for Google to produce a CrUX report. So for the time being, you will have to trust the lab scores and our word that the site loads instantly. We will update this post with field data as soon as Google decides we are popular enough to measure.
The Battle Is Not Over
Performance optimization is not a one-time project. It is an ongoing discipline. Core Web Vitals fluctuate with traffic patterns, device distributions, network conditions, and code changes. A score that looks perfect today can degrade tomorrow after a new feature ships or a third-party script updates.
We monitor CWV signals closely for every project we manage. When metrics shift, we investigate. When they degrade, we respond. The work documented here is one iteration in a continuous cycle of measurement, optimization, and verification. The desktop score will continue to improve. The mobile score will stay at 100. And if it does not, we will know about it before anyone else does.
A Word of Honest Warning
Three.js is powerful. It is also expensive to implement well. The procedural mesh on this homepage took roughly 25 to 30 hours to build: the simplex noise terrain generation, the responsive breakpoint system (different grid densities for mobile, tablet, desktop), cursor-reactive lighting, touch and gyroscope input handling, WebGL context loss recovery, connection-aware loading that skips the entire pipeline on 2G networks, reduced motion support, and the CSS fallback pattern for when WebGL is unavailable.
The optimization pass documented in this article added another 6 to 8 hours on top of that. Profiling, identifying bottlenecks, implementing the dynamic imports, building the yielding system, testing the auto-pause mechanism across browsers, and verifying that nothing visual changed.
That is 35+ hours of engineering for a single background effect. It looks effortless. It was not. If you are considering Three.js for a production site, budget accordingly. The library itself is free. The expertise to use it without destroying your performance metrics is not.
Takeaways
Premium visuals and top-tier performance are not mutually exclusive. They require intentional engineering. Every script, every animation loop, every import statement is a decision about what the main thread spends its time on.
The techniques here are not Three.js-specific. Dynamic imports, task yielding, interaction-based activation, and idle detection apply to any heavy JavaScript workload. The principle is the same: do the minimum work necessary to show the user something meaningful, then do everything else when they are not looking.
If you are running Three.js, GSAP, or any other substantial library on a performance-sensitive site, profile first. The most impactful optimization might be removing a single unnecessary function call.
Want a site that looks this good and loads this fast?
We build premium digital experiences that don't compromise on performance.

